|
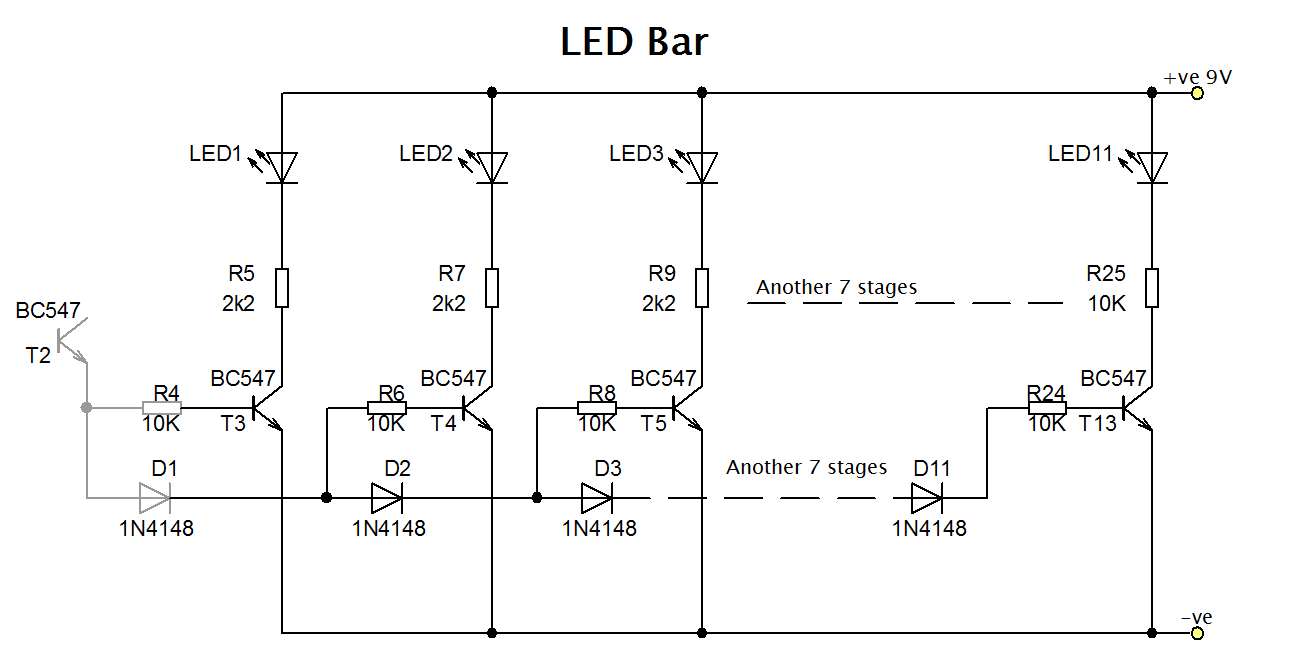
Circuit diagram for an 11 element LED bar graph
The circuit below shows 4 stages of an 11 stage bargraph. All 11 stages are identical so I haven't tried to draw them all. Stages 4 - 10 should be inserted where it says "Another 7 stage".
Notice that the input to the bargraph is shown connected to the emitter of transistor T2 which is the the final part of a high impedance input circuit shown later on this page. I've separated the two diagrams to try and make things a little clearer.
 11 stages of LED bar graph
You can make a bargraph with as many LEDs as you want provided that the supply voltage is high enough. I found that I could drive 11 stages of LEDs with a 9V supply from a battery.
High impedance input circuit
The Input to the bases of the transistors in the bargraph stages are connected with a 10kΩ resistor. With 11 of them effectively in parallel this makes the input resistance or impedance roughly 1kΩ which is quite low. It's so low that it could interfere with any circuit that you might connect it to by presenting a significant load on it.
To avoid loading down the circuits that you want to use the bargraph with a high input impedance input stage is used. Transistors T1 and T2 are connected in a darlington pair arrangement which provides a very high level of amplification or gain and allows the high impedance input to be converted to a low impedance output for the bargraph circuit.
 High impedance input circuit
How the bargraph works
Transistors T3 to T13 and turned on progressively as the input voltage rises. This effect is produced by connecting the bases of the transistors to successive diodes D1 to D11 which are wired in series. When diodes conduct a potential of approximately 0.6V is developed across the diode. By connecting the diodes in series voltages can be tapped off from each of the connections which are all 0.6V lower than the previous connection.
When the voltage on the emitter of T2 rises to 0.6V the first LED driver transistor T3 turns on. When the voltage on the emitter of T2 reaches approximately 1.2V not only does T3 remain on but T4 is also turned on. Each transistor in the chain turns on one after the other as the input voltage rises until it reaches 6.6V when all LEDs are illuminated.
How the high impedance input and level shifter works
The input circuit needs to do two things. First you need a high impedance input which is provided by the darlington amplifier. A level shifter is also required to offset the 0.6V that the first bargraph transistor T3 needs to turn on and also the 1.2V dropped by the darlington transistor pair.
To provide the required offset of 1.8V I've used two resistos R1 & R2 to act as a potential divider to add a voltage to the input. To ensure that the offset voltage is constant and doesn't depend on the supply voltage which may vary significantly if it comes from a battery, I've used an 8.2V zener diode to act as a reference voltage and provide a constant voltage across the potential divider on the input.
The offset voltage which the potential divider adds when the input voltage is zero can be calculated: ((0.89/(3.9 + 0.89)) * 8.2 = 1.42V which should be just short of the voltage needed to start making the first transistor conduct. The bargraph that I built using high efficiency LEDs runs with the first LED slightly illuminated when the input is zero volts which is perfect for my needs.
The good and the bad
The nice thing about this bargraph is that each LED illuminates gradually before reaching maximum and the next LED starts to glow. This allows for some estimation of the input value inbetween the 11 LED steps of the bar and produces a smooth change from level to level.
The downside of the circuit is that if you leave the input disconnected then all of the LEDs will glow. This is because the potential divider providing the offset voltage will turn on T1 and T2. While this behaviour is not intuitive it could be considered to be fail-safe in some situations. For instance if the bargraph was measuring temperature and suddenly all the LEDs are illuminated then it is probably a sign that something is wrong. Even if it's just the sensor that has become disconnected.
| 


Comments (6)
Thank you, Thank you, Thank you, for your generous sharing.
Tim
Add Comment